Figuring out the difference between fact and dimension tables in Power BI can be complicated. In this blog post we’ll go over the difference between the two and when they should be used. When you are building a data model fact and dimension tables are the two types of tables that should be used. Just to provide a basic working definition:
- Fact Table: Contains data about an event, holding aggregated numeric data that you want to analyze.
- Dimension Table: Tables that keep metadata that describe the fact table that can be used to filter the fact table
Typically in a data model you would have a single fact table and multiple dimension tables related to each other through keys.
Fact Tables
There are many different types of fact tables but most people could instantly recognize one when they see one. A quick example of a fact table would be a Sales Table that contains columns like:
- OrderID
- CustomerID
- Order Quantity
- Sales Total
- COGS
- Taxes
Fact tables include two types of fields, either the column is a key column to a dimension table or its a “Fact”. Those “Fact” columns must be either a numeric or aggregated field. To return to the example above:
- OrderID – key
- CustomerID – key
- Order Quantity – fact
- Sales Total – fact
- COGS – fact
- Taxes – fact
Dimension Tables
Dimension tables contain metadata that describes the fact table. Continuing the sales example from above, an example of a dimension table might be a customer table that includes:
- Customer ID
- Customer Name
- Customer Age
- Country
In this example, the Customer ID is the primary key for the table that relates back to the Sales “Fact” table above. The other fields would be dimensions that describe the fact table. Another example of a dimension table based on the above fact table could be:
- Order ID
- Order Items
- Item Description
- Order Taker
The Order ID column would be the unique key used to relate back to the fact table and the other fields would be the dimensions.
Relationships
Typically in Power BI, Fact and Dimension tables are used to support a star schema data table. A Star Schema contains one fact table and multiple dimension tables as shown below:
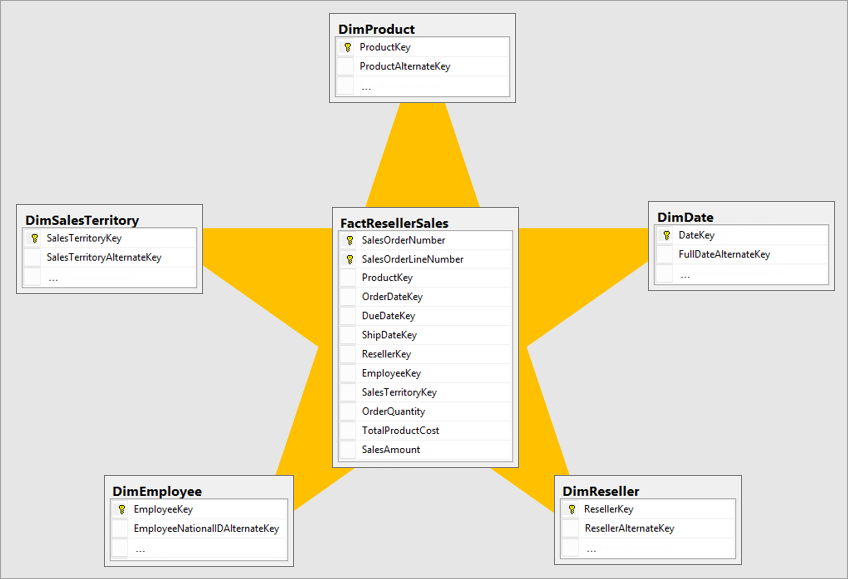
In a Star Schema, the fact table relates to every dimension in a “many to one” relationship. This allows each dimension table to effectively filter the data that is contained in the fact table.
Note: Unless you really understand the concept of a “many to many” relationship avoid those as they can cause unpredictable consequences.
Benefits of Not Using a Single Table
At this point your thought may be that rather then using a relational schema it may be easier to create one gigantic table to contain your data. Please don’t do this! You will save yourself a lot of headaches later on if you avoid this method. A few reasons why that’s the case:
- It’s not always possible to merge data tables. For example, how would you merge an operational budget table with a customer information table? As your report expands you’ll run into situations where you weren’t planning on adding more data and you’ll have to go back and redo your model.
- Maintenance is a pain.
- Every time you add a column to the table you will need to store additional data.
- Performance slows down because the computer has to load the data in a single table and hold it in memory.
Summary
Using fact and dimension tables in Power BI gives you a very clean and simple way of interacting with your model. You may need to create some additional measures and columns to support using the method, but its worth it. The time you will save in maintaining your model will more than make up for it.


0 Comments