Real Estate Professionals – Agent Performance Dashboard
A near real-time dashboard view of agent and company performance with customizable filters to allow the user to select the combination of dates and metadata that they want to see.
Challenge
How can we help the manager of a team of real estate agents make effective personnel decisions?
The manager of a group of real estate professionals needed a way to track team performance and analyze sales metrics on a per user basis. Having no way to track data for the team made it very difficult to make effective personnel decisions.
Pain Points
No way to view agent performance over time and track key metrics related to company growth.
Our Solution
Track performance in real time in Power BI
Utilizing SharePoint as a backend storage solution, we ingested the teams data using a combination of Power Automate and plain old Excel. After we had all the data in one place, we designed a Power BI dashboard that would focus on the KPIs and metrics that this manager wanted to target.
The Power BI report gives an overall team view as well as provides a snapshot of an individual agent over a customizable period of time. Filters on the page allow the user to break down each piece of metadata to any depth and combination needed.
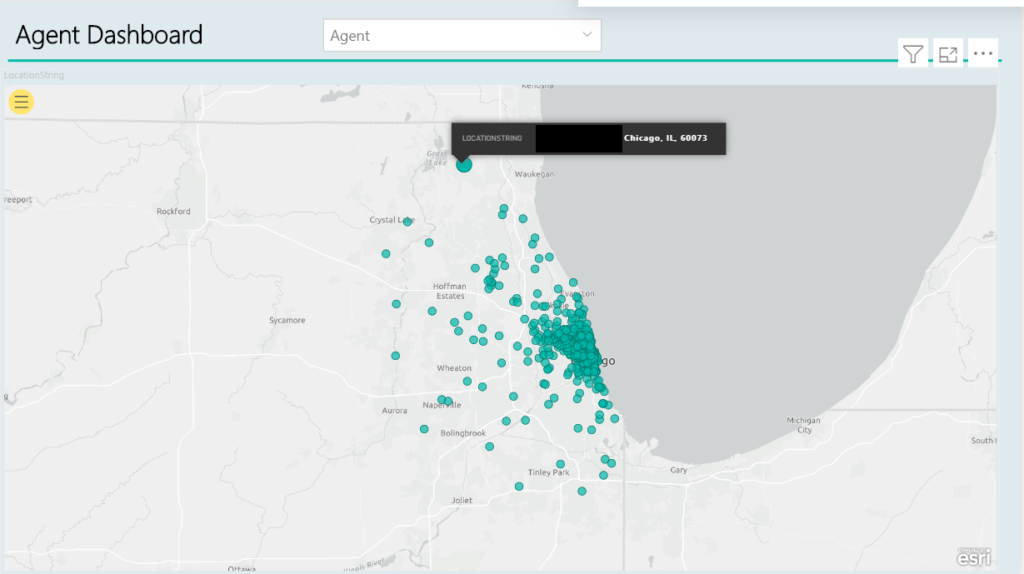
Providing a map view of the properties sold allowed the team to focus on historically weak areas and pinpoint where they were strong.
Results
Centrallized Report
The manager now has a single report for reviewing employee performance and tracking company performance.
Automated Data Import
Data gets fed in automatically from various systems to create this performance dashboard.
Improved Insights
The reports developed provided more robust analysis of agent performance for the client leading to more effective personnel decisions.
Ready to Talk Power Platform or Dynamics 365?
We work with customers every day to automate workflows, modernize apps, and unlock the full value of Microsoft solutions. Tell us about your goals, we’ll help you find the right path.