
Case Study: Law Firms
Attorney Billing & Performance Dashboard
Providing an easy-to-use analytics tool for partners at a law firm to better understand how their attorneys are performing and get a deeper understanding of their budgets.
Challenge
How can we provide the partners of the firm better insights into how their attorneys and matters in general are performing?
The managers of a law firm had no way to visualize the amount of revenue they were bringing in over time, and analyze it by attorney and client. All the billing data was kept in a 3rd party solution that the firm could only access by excel exports.
Pain Points
The team had to manually export data from the time management system in order to build reports in Power BI
The existing tool was built with excel and had to be updated and re-shared with users each time new data was exported.
Our Solution
Seamless integration with Power BI and Power Automate
Automate the daily export of excel files to a shared file location and from there, automatically pull the data into Office 365 via Power Automate. Once the data is in our system, a Power BI report was created on top of it to visualize key company metrics.
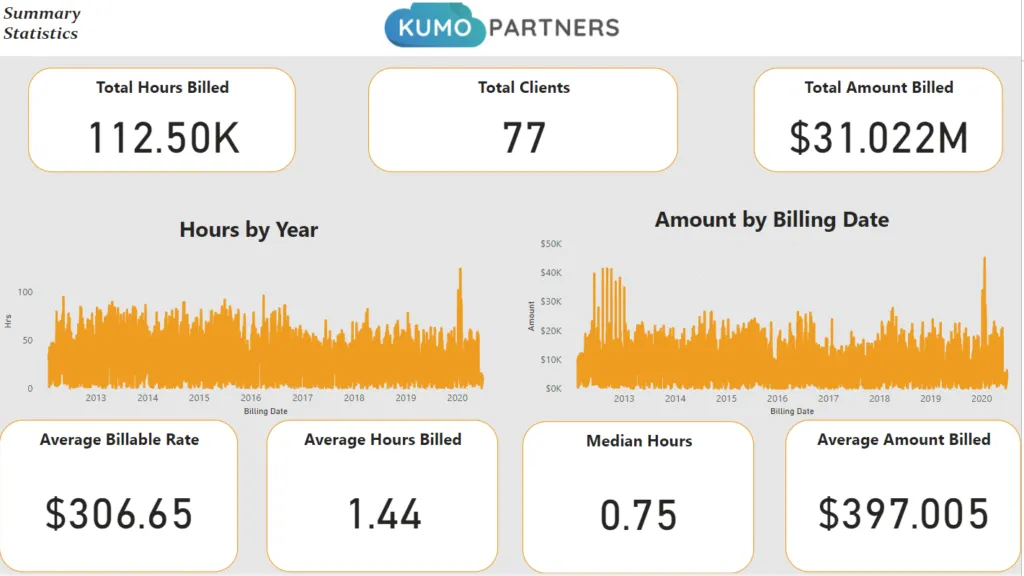
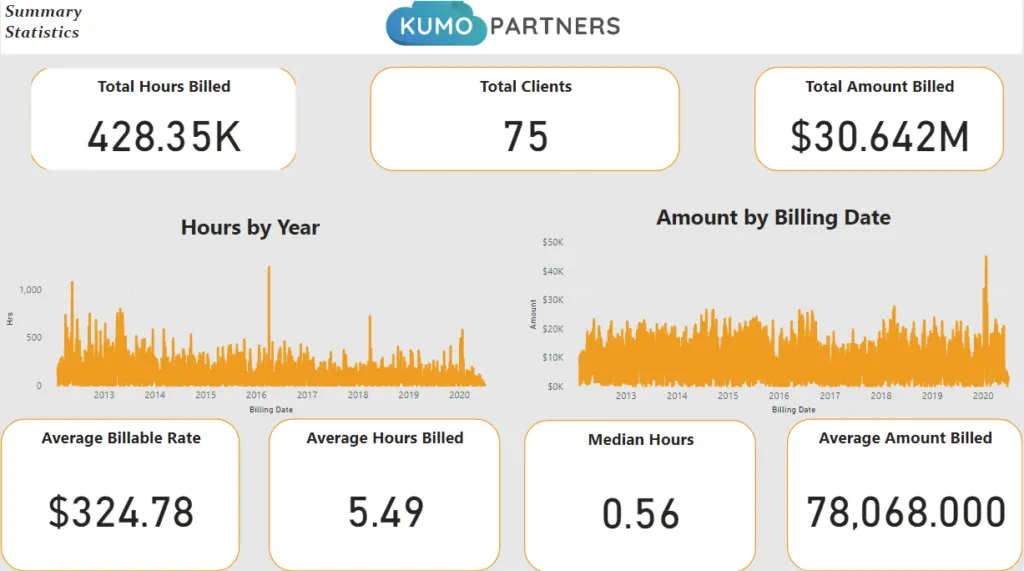
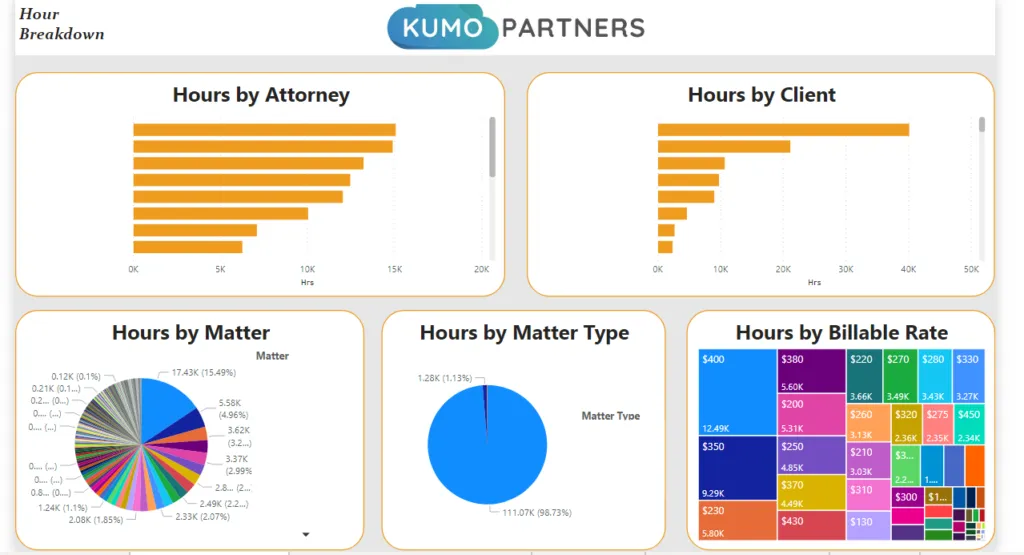
Managers have the ability to enter the report and view their KPIs in easily digestable graphs and visualizations. They can view their teams performance, and track it against their performance in previous years. In addition, they can view client billing health and information as well as get a glimpse into what factors effect their project profitability.


Results
Centrallized Report
The partners of the firm now have a single report for reviewing project budgets and tracking performance.
Automated Data Import
The client would have to manually export the data in order to build reports in excel. Now it imports automatically
Improved Insights
The reports developed provided more robust analysis of projects for the client leading to improved budget tracking.